
Logistics Platform
Coordination layer for supply chains, ports, and transport networks.
How this platform works in everyday language.
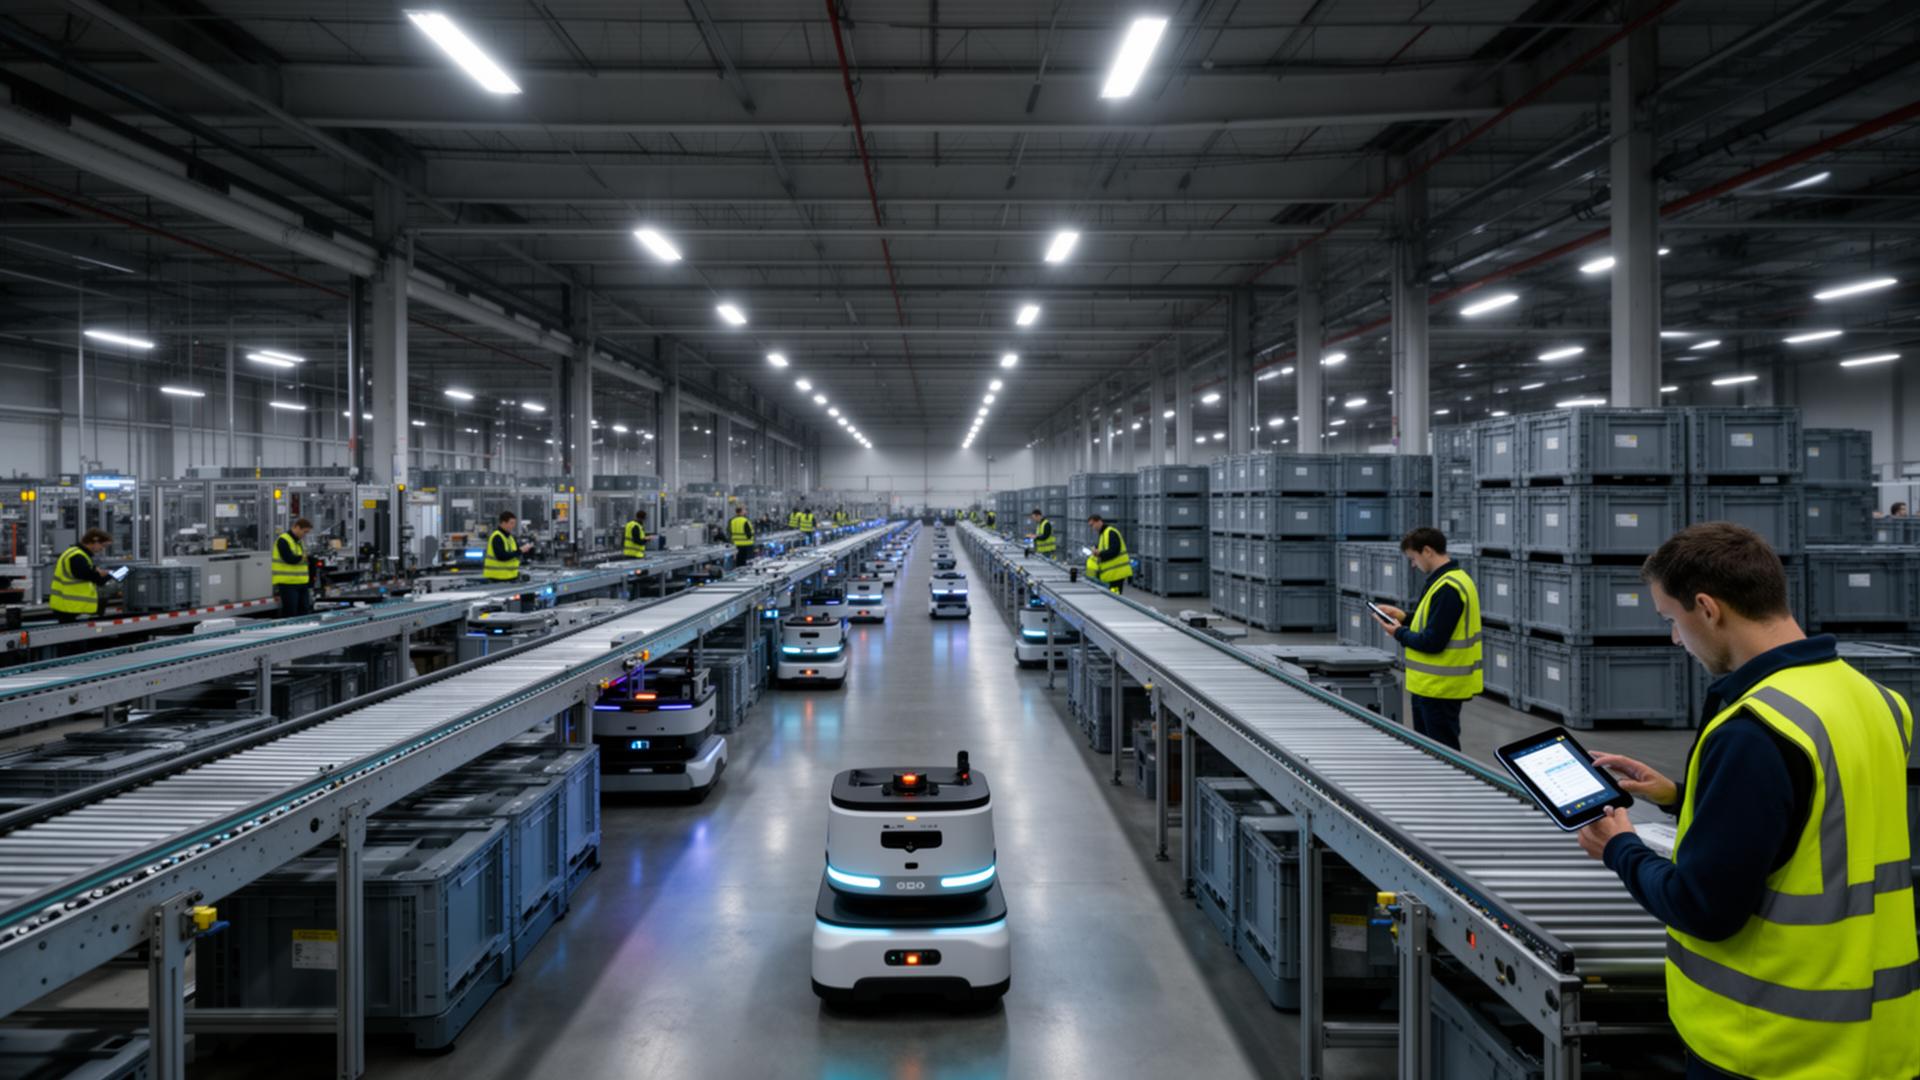
Moving goods across borders in Africa and emerging regions can take weeks because seaports, customs officers, trucking companies, and rail lines work in isolation. A single container often requires dozens of paper stamps, leading to long traffic jams at port gates and border posts. Cerebro Dynamics Logistics connects port authorities, customs agencies, shipping lines, and freight forwarders onto one shared digital corridor. Operators can track cargo from container ship to inland warehouse, eliminate customs clearance delays, and route trucks around traffic jams before congestion starts.
What this platform addresses.
Supply chains depend on dozens of operators with non-aligned data models, leaving operational decisions blind to upstream and downstream signals. Cerebro Dynamics Logistics turns the corridor into one operating system.
Who uses this platform in daily work.
Optimizes container crane movements, yard stacking layouts, and truck gate appointments to eliminate port queues.
Automates electronic manifest risk screening and approves legitimate cargo in minutes while flagging high-risk boxes.
Tracks three hundred semi-trailers moving across international highways with live fuel, speed, and GPS sensors.
Monitors average border transit times, road bottlenecks, and weighbridge delays across national transport links.
How the system is built.
Event-driven backbone unifying customs, terminal, fleet, and warehouse data into operational and strategic views, with strong tenant separation across competing operators.
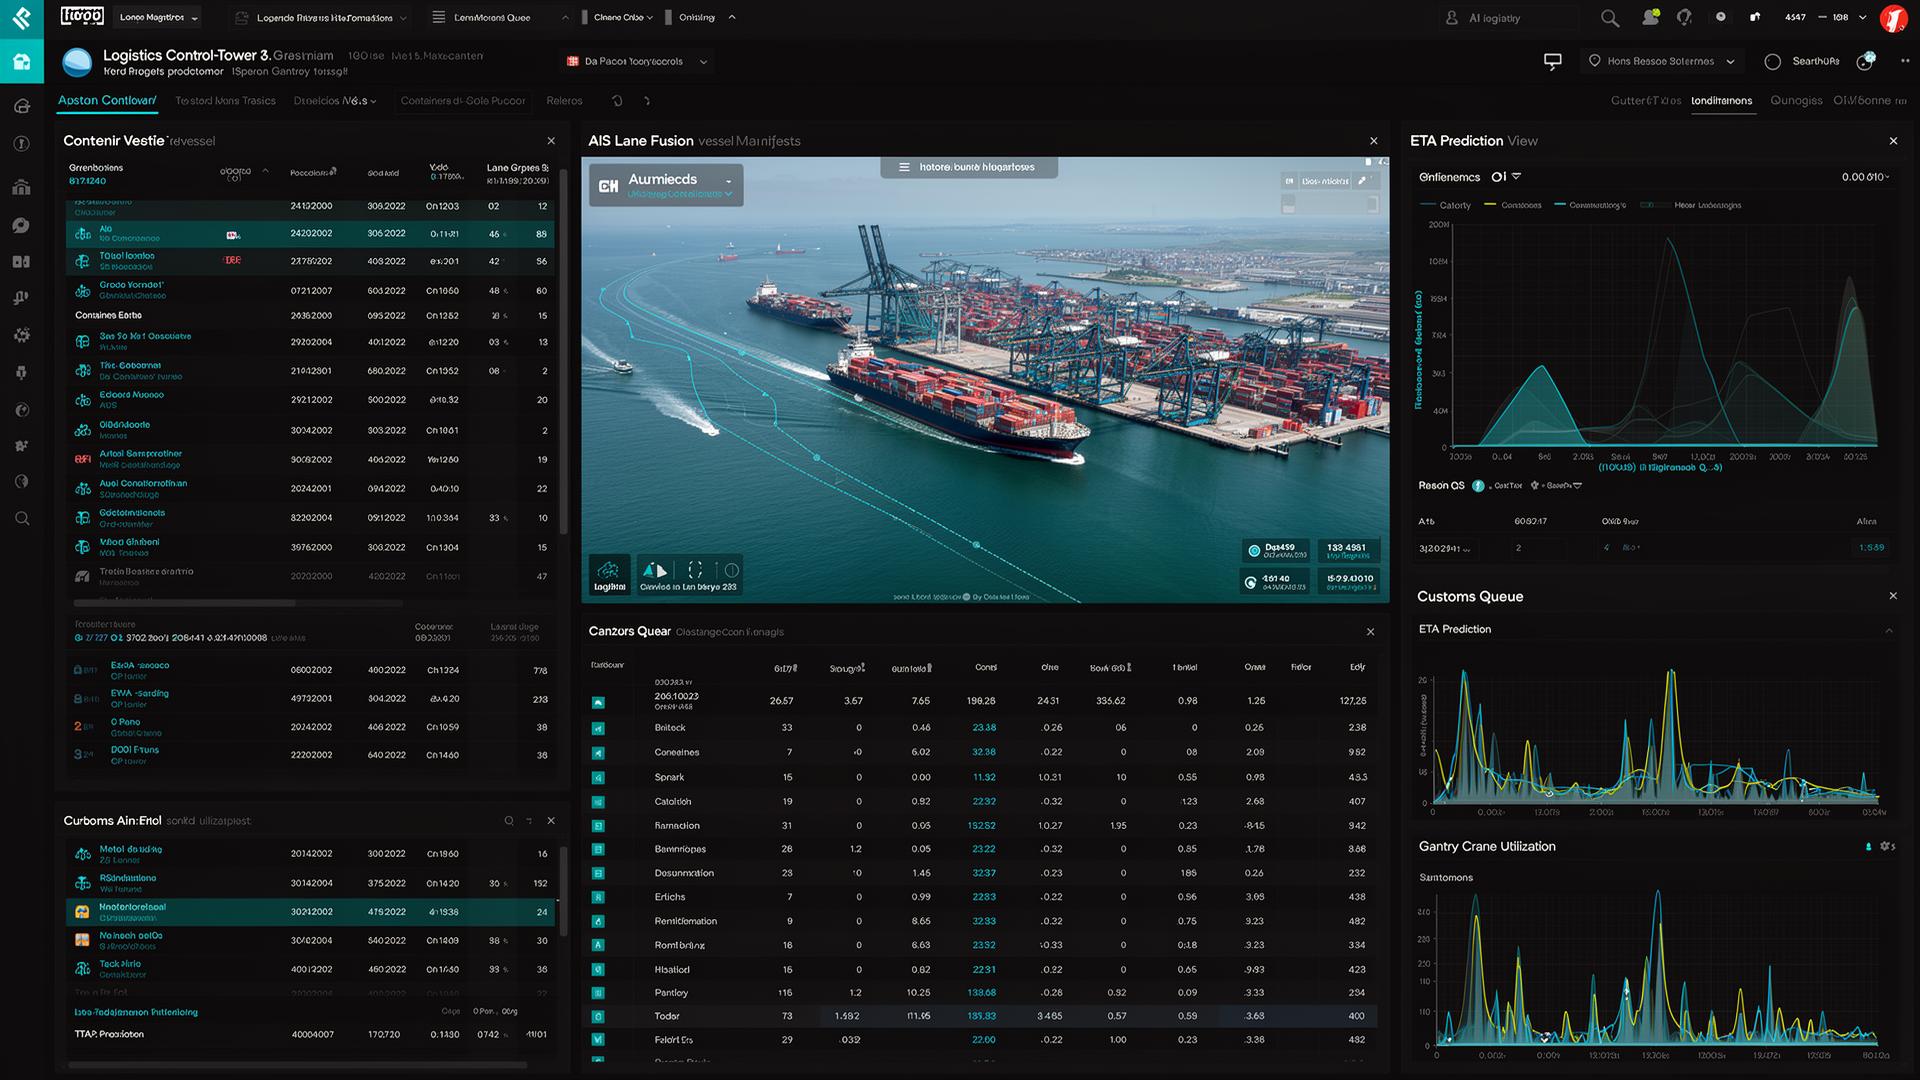
What ships in the platform.
End-to-end visibility across modes and operators.
Crane, yard, and gate orchestration.
Compliance and clearance integration.
What-if modelling across the network.
What it does.
- 01Shipment and asset visibility (ocean, road, rail, air)
- 02Port and terminal operations
- 03Customs and compliance integration
- 04Network optimization
- 05Disruption modelling and re-routing
- 06Cross-operator coordination with tenant isolation
Real-world operational examples.
Slashing Container Dwell Times at a Major Seaport
Import containers sat idle in terminal yards for an average of eleven days, causing vessel anchoring queues and heavy shipping penalty fees.
By uniting shipping line manifests, terminal crane schedules, and customs clearance releases on one dashboard, freight handlers booked gate pick-ups the moment cargo cleared inspection. Average yard dwell time dropped from eleven days to under four days within three months.
Streamlining Cross-Border Trade Under AfCFTA
Trucks hauling manufactured goods waited five days at an international border post due to duplicate inspections by two neighboring customs services.
Both customs services shared a single digital inspection record on our Corridor View module. The pre-cleared trucks scanned a single QR code at the border gate and crossed in twenty-five minutes instead of five days.
A typical operating loop.
An operations manager sees a developing port congestion, simulates rerouting options across modes, commits decisions back into partner systems, and tracks exposure end-to-end.
Data model.
EDI, IoT, AIS, customs and ERP data with corridor-level ontologies.
Posture.
Strict tenant separation across competing operators, with auditable cross-flows.
DeploymentRegional cloud with edge gateways at terminals.
What operators ask before deployment.
Where it is deployed.
- Logistics and Transport
- Manufacturing and Industrial