
Agriculture Platform
Decision infrastructure for food systems and agricultural economies.
How this platform works in everyday language.
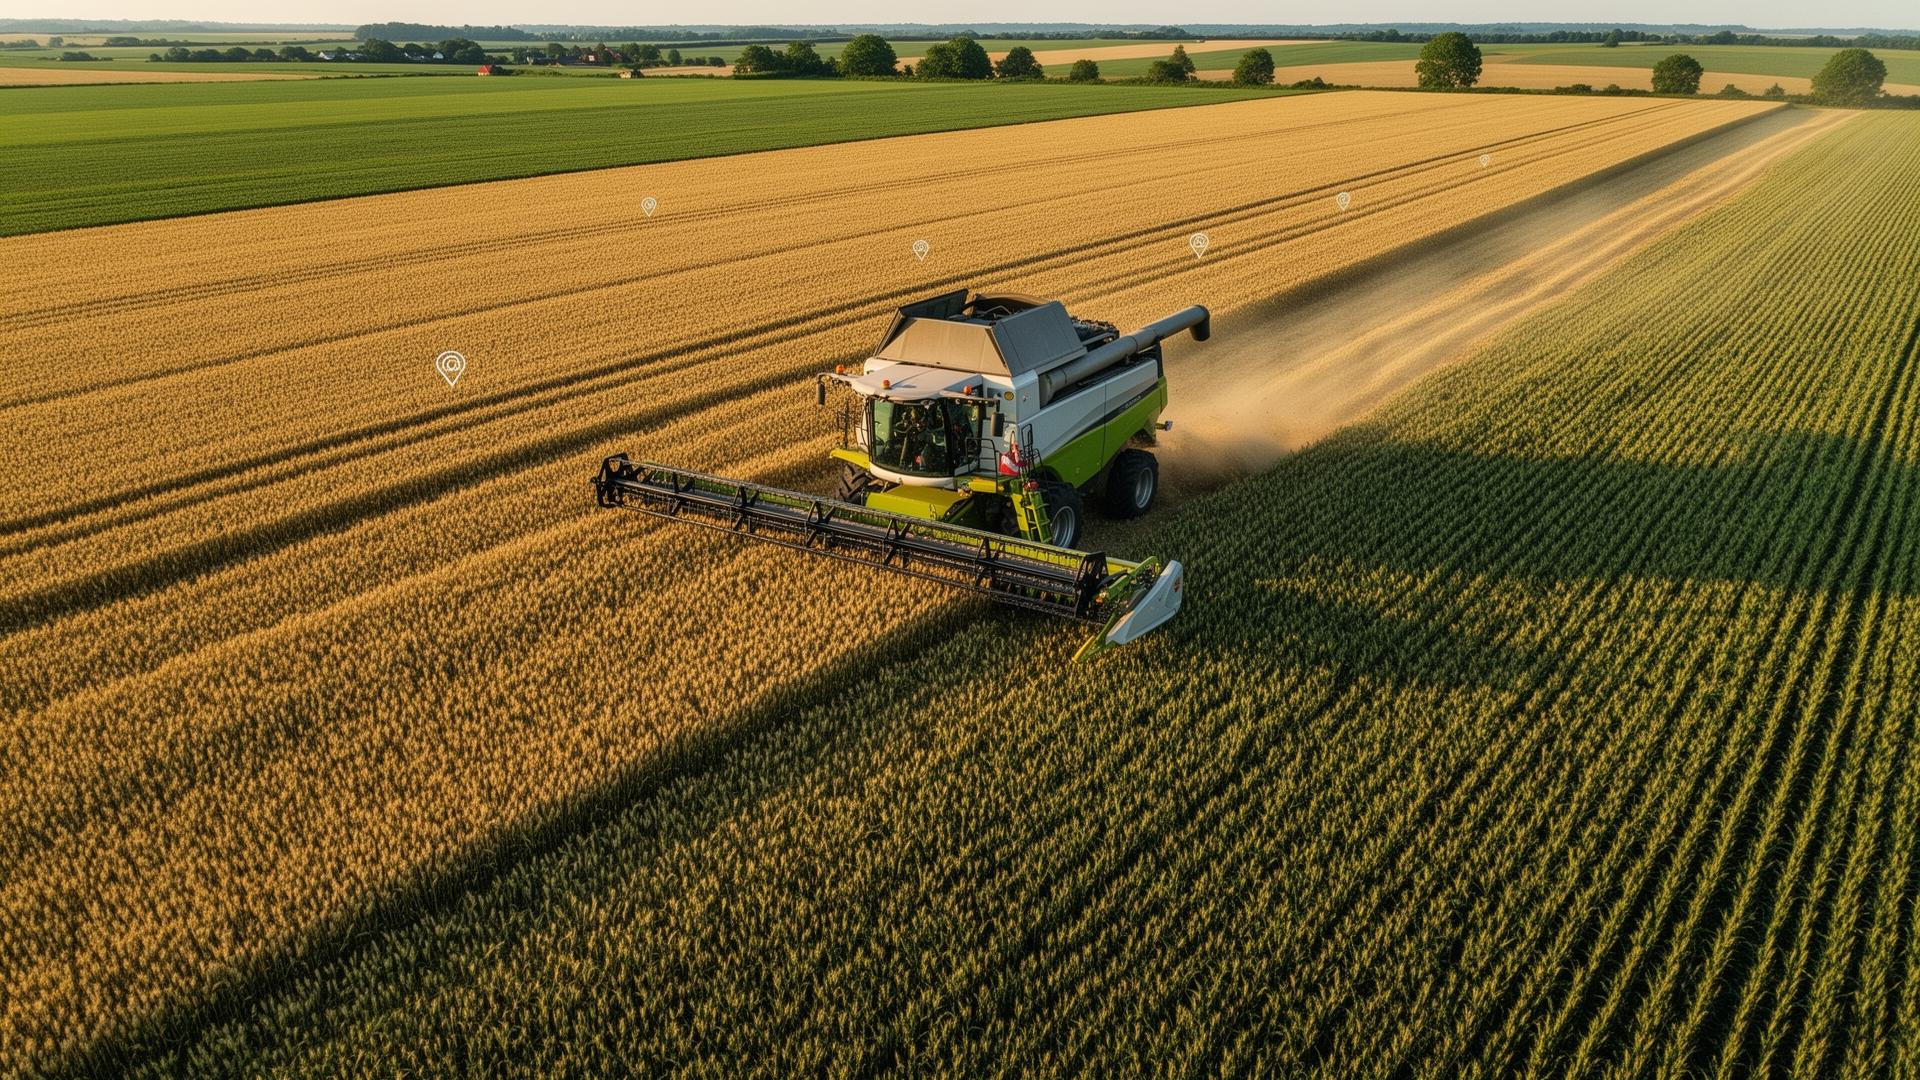
Farming in Africa and emerging economies faces huge climate risks, unpredictable rain, and fragmented supply chains. Small farmers do not know when fertilizers will arrive, and food ministries cannot tell if harvests will be enough to feed the population until prices spike. Cerebro Dynamics Agriculture brings satellite weather scans, soil moisture readings, market grain prices, and cooperative warehouses together on one live map. Planners can see which crops are thriving or suffering, forecast yields months in advance, and move seeds and fertilizers exactly where farmers need them.
What this platform addresses.
Production data, market signals, weather, and logistics rarely converge in time to support coordinated action. Cerebro Dynamics Agriculture compresses field, market, and policy into a single planning surface.
Who uses this platform in daily work.
Forecasts national maize, wheat, and sorghum production three months before harvest using satellite vegetation indices.
Coordinates bulk fertilizer purchases, seed distribution, and tractor rentals for twelve thousand smallholder farmers.
Verifies drought or flood damage using satellite soil moisture data to settle farmer claims without expensive field inspections.
Monitors harvest delivery volumes and road transport conditions across commercial grain corridors.
How the system is built.
Earth observation, in-field IoT, market data, and operational systems fused into a single decision surface with regional ontology and edge-tolerant deployment.

What ships in the platform.
Satellite and drone analytics for crop health and water stress.
Production estimates by region, crop, and season.
Price discovery and demand signals across corridors.
Coordination and advisory layer for field operators.
What it does.
- 01Crop monitoring with satellite and drone imagery (NDVI, EVI, soil moisture)
- 02Yield and harvest forecasting
- 03Soil and water analytics
- 04Market and price intelligence
- 05Cooperative and supply-chain coordination
- 06Climate and pest risk modelling
Real-world operational examples.
Early Warning for Severe Drought in the Rift Valley
A delayed rainy season threatened eighty thousand hectares of staple crops across twenty-four farming districts.
The platform detected declining vegetative health (NDVI) and dry soil profiles four weeks before visible crop withering. The agriculture ministry reallocated emergency grain reserves and distributed drought-tolerant seed varieties to affected cooperatives in advance, preventing local food shortages.
Preventing Fertilizer Bottlenecks at Planting Season
Thousands of smallholder farmers struggled to get subsidized fertilizer on time due to inventory hoarding and port congestion.
The Cooperative Bridge module tracked fertilizer trucks from port terminals directly to regional warehouse gates. Cooperative managers dispatched daily text updates to farmers, reducing depot wait times from four days to under two hours.
A typical operating loop.
A regional planner monitors crop stress signals, adjusts input distribution, dispatches advisory to cooperatives, and tracks the response in market and field outcomes — all on the same map.
Data model.
Geospatial, IoT, market, and operational data with regional ontologies and offline-first edge support.
Posture.
Farmer and cooperative data sovereignty, with controlled sharing across institutional partners.
DeploymentRegional cloud with edge presence in low-connectivity environments.
What operators ask before deployment.
Where it is deployed.
- Agriculture and Food Systems
- Government